
A frontend engineer handing an API response to a teammate wiring a map widget needs a readable field path, not a wall of nodes. The question is narrow: is latitude at geo.lat or address.geo.lat? I imported a fictional Seattle user into JSON Crack to make that nesting visible. One record gave me a readable address branch beside the source. Ten records gave me a tall graph whose values became tiny after fit-to-center. For this task, success means the teammate can trace the nesting and check the value’s type against the source. A graph that merely fits on screen is not enough.
By ToolBrivio Editorial. We tested the hosted JSON Crack editor in desktop Chrome on October 11, 2026, using our own fictional Seattle user fixtures, imported as JSON data URLs. Screenshots are from that session. URL import, fit-to-center and collapse/expand were verified. Direct text editing, local-file import and an exported image file were not successfully verified with our testing browser; those outcomes are outside this review. We did not benchmark large files or audit network traffic. No affiliate commission is earned from these links.
Build the small fixture for the walkthrough
We opened the editor, chose File → Import, and entered a data:application/json URL in the URL of JSON to fetch field. The URL contains the fixture itself rather than pointing to a remote API. This JavaScript generates the exact single-user fixture and import URL we used:
const user = {
  "id": 1,
  "name": "Alex Morgan",
  "username": "alex",
  "email": "alex@example.com",
  "address": {
    "street": "123 Example Lane",
    "suite": "Suite 100",
    "city": "Seattle",
    "zipcode": "98101",
    "geo": {
      "lat": "47.6062",
      "lng": "-122.3321"
    }
  },
  "phone": "206-555-0100",
  "website": "example.com",
  "company": {
    "name": "Example Labs",
    "department": "Engineering",
    "region": "US"
  }
};
const importUrl = "data:application/json," +
  encodeURIComponent(JSON.stringify(user));
console.log(importUrl);
Run the snippet in a JavaScript console, copy the printed URL into the import field, and click Import. The single-user JSON fixture is also available to download. All contact details are fictional; Seattle is the US test setting.
After clicking Import and allowing the response to load, the left pane contained a user object. The Valid indicator was visible. On the right, the graph separated the main user properties, address fields, geographic coordinates and company details. We clicked fit to center to see the whole structure.
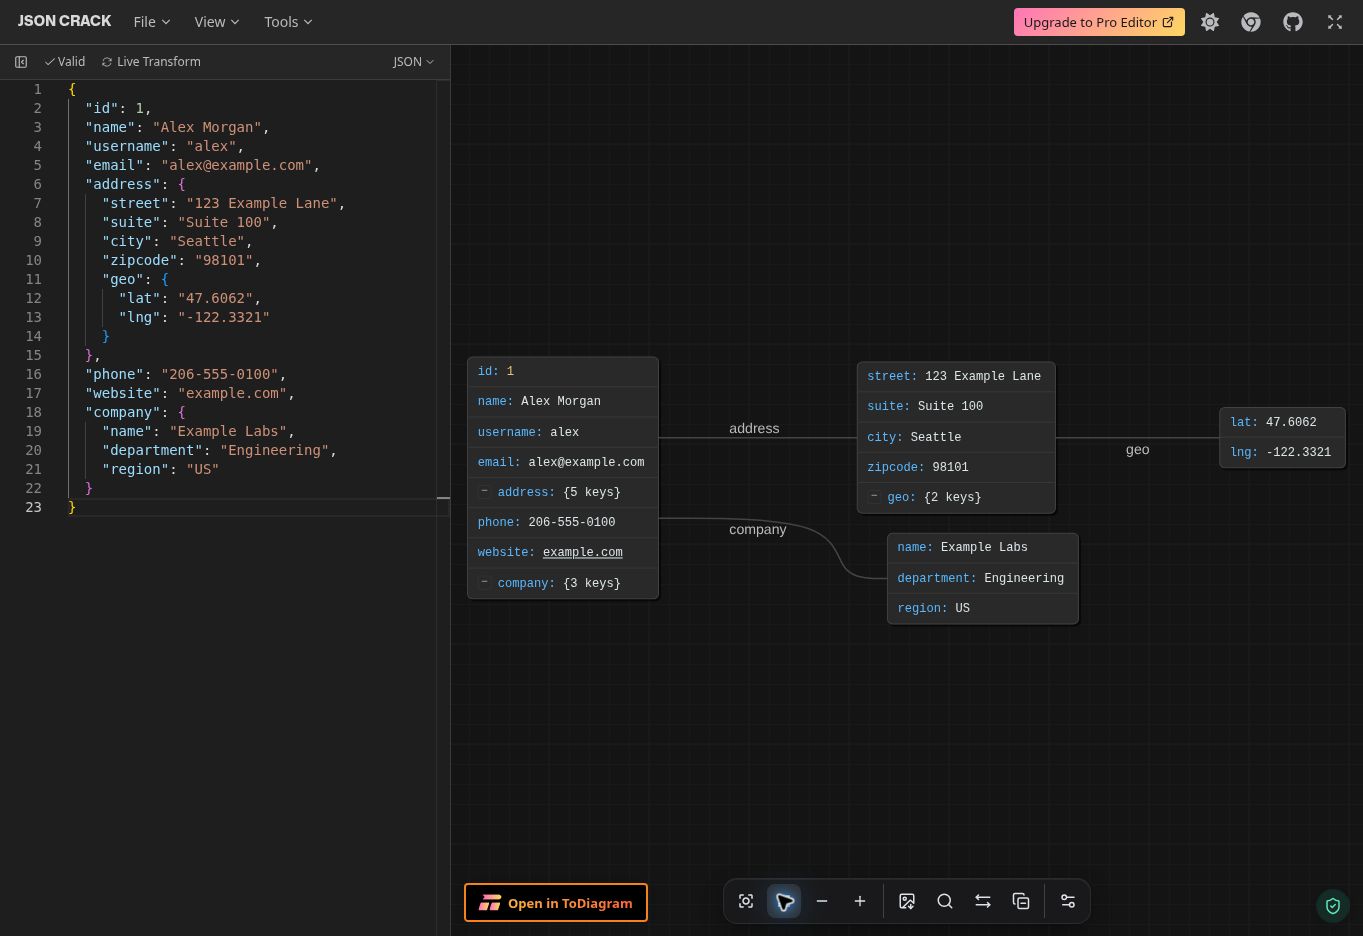
The graph answered a concrete integration question: geographic coordinates belong under address, while company is a sibling of address. That matters if you are writing a form mapper and are about to read the wrong path. Compared with explaining the same path by counting closing braces in formatted source, the labeled connection makes the containment visible directly. It avoids that manual tracing in the walkthrough; we did not measure a time saving or test comprehension with other users.
The graph does not change the data’s types. In the source, latitude and longitude are quoted strings. Their appearance as coordinate values does not make them numbers, prove they are usable map coordinates, or establish any relationship to another record. Treat the edges as the nesting structure of this document.
Hide branches while explaining the user object
We clicked collapse all. The address and company descendants disappeared from the graph; the main card retained collapsed summaries showing five address keys and three company keys. The left pane still showed the complete JSON, including the nested geo object. The control changed to expand all, and expanding restored the branches.
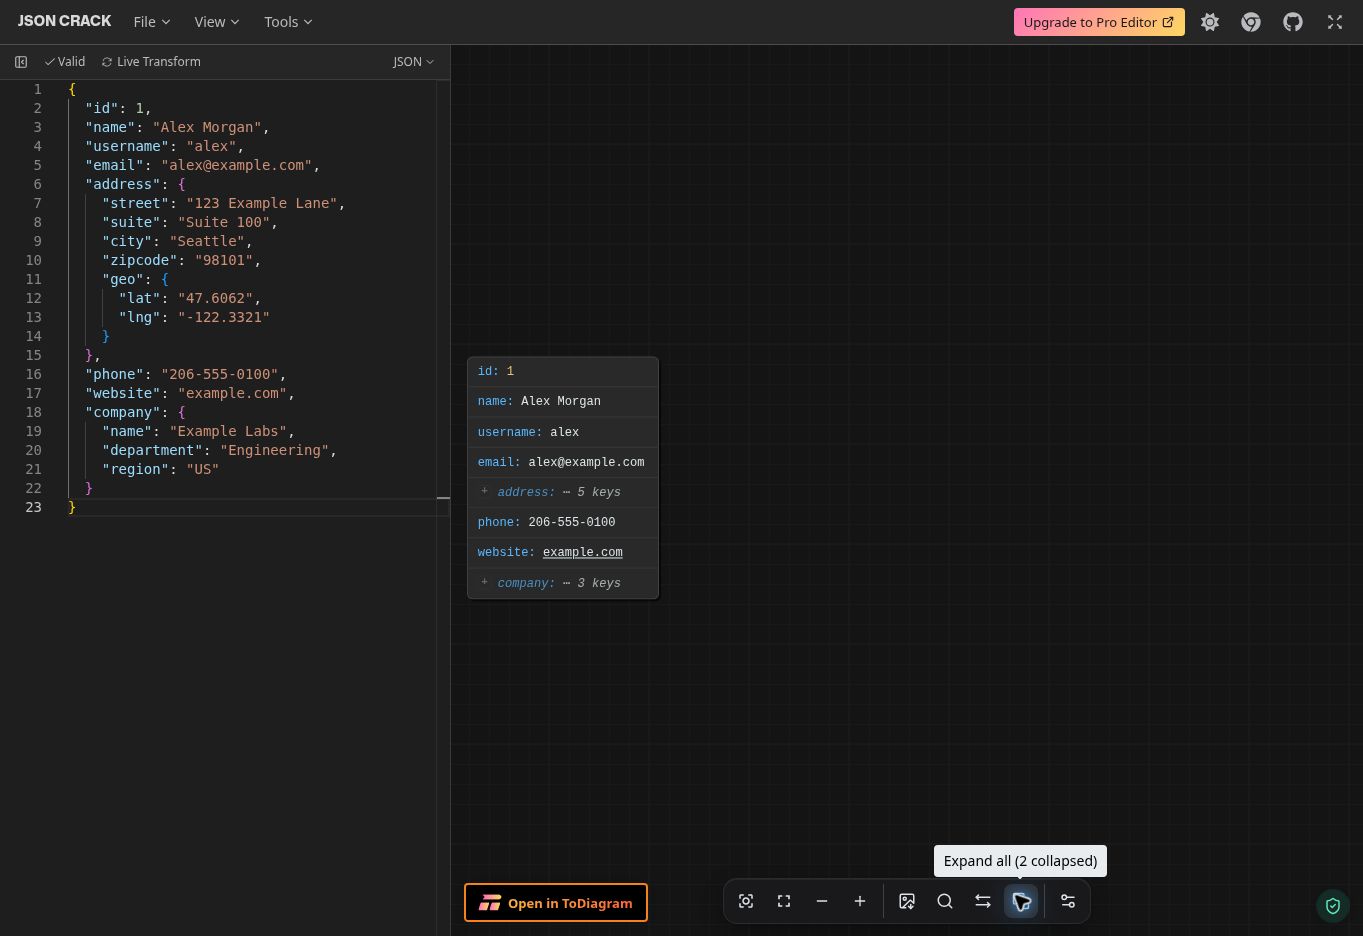
This is convenient for a walkthrough: start with the user-level fields, then expand the branch under discussion. It is not redaction. A collapsed address still exists in the source, and this screenshot includes that source. If you need a safe image for a ticket or public article, sanitize the document first rather than relying on collapsed nodes.
Then try the whole ten-record collection
We next created ten variants of the same fictional Seattle record and imported another data URL:
const users = Array.from({ length: 10 }, (_, i) => ({
  ...user,
  id: i + 1,
  name: "Test User " + String(i + 1).padStart(2, "0"),
  username: "testuser" + (i + 1),
  email: "testuser" + (i + 1) + "@example.com"
}));
console.log("data:application/json," +
  encodeURIComponent(JSON.stringify(users)));
The ten-user JSON fixture contains the same test data. Each object has the same nested address and company structures. After fit-to-center, the graph became a tall stack of branches. The overview showed the repeated shape, but individual labels and values were much smaller than in the single-object view. The text editor remained readable at its own scale.
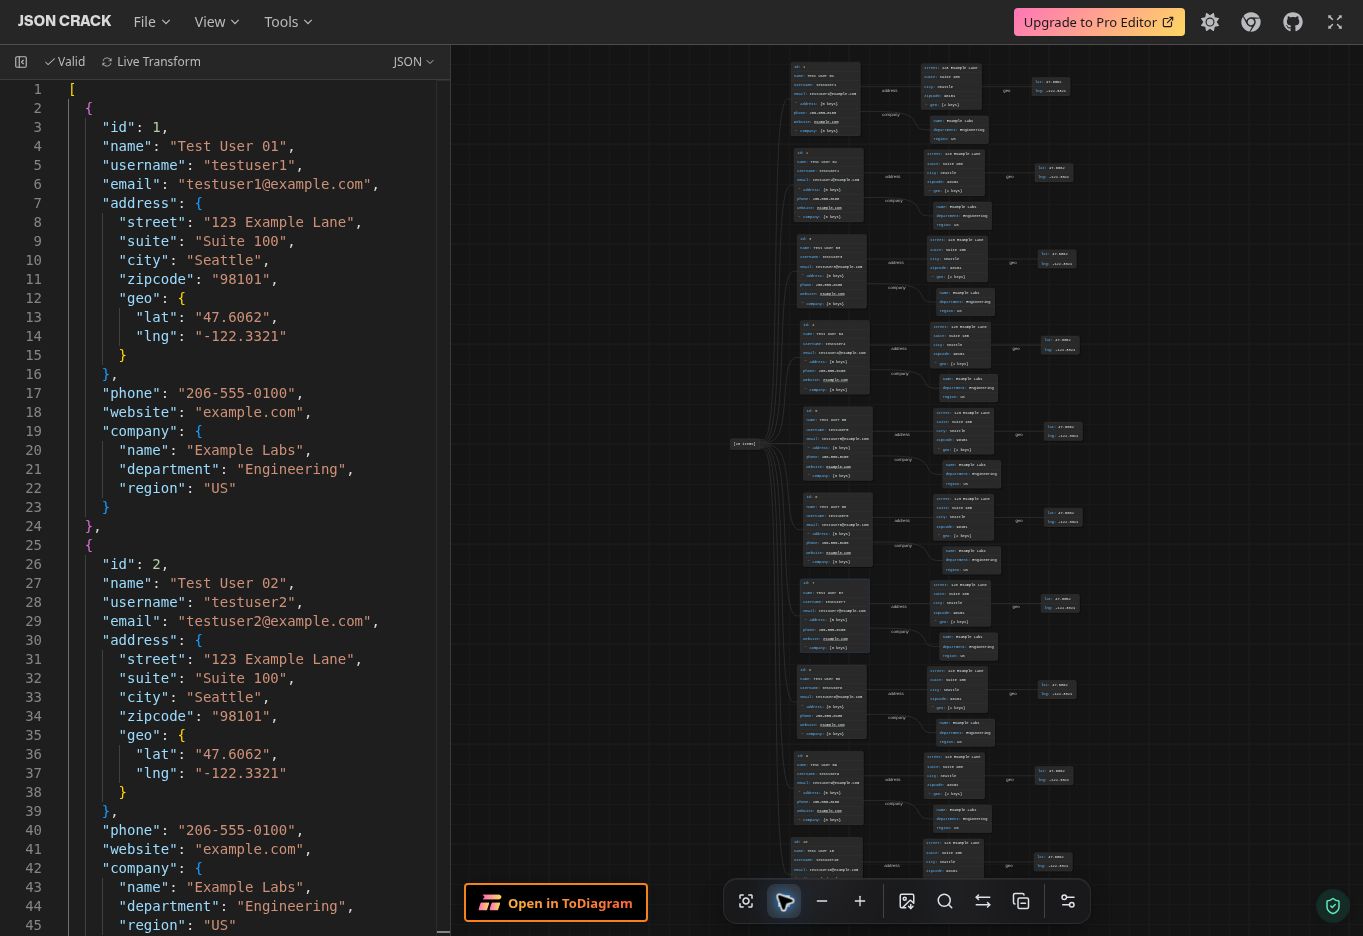
A graph can fit on screen and still be a poor way to read the data. For a response review, start with one representative record, inspect the nested structure, then check alternate records in text or with a query. If one item has a different shape, isolate that item for a second graph. Do not assume the first object describes the whole collection.
We did not measure load times, find a maximum file size or intentionally hit a node limit. The official repository documents a configurable NEXT_PUBLIC_NODE_LIMIT for local deployments, but that is not evidence of the hosted editor’s current allowance. A small ten-record readability test cannot establish large-file performance.
What I would send with the diagram
- Prepare a sanitized, representative response. For a reproducible public test, use the fictional Seattle fixture above.
- Choose File → Import, enter the generated JSON data URL and click Import. Verify that the source pane changed to the intended response before inspecting the graph.
- Check the Valid indicator and compare the source with the graph. Trace the path to the field your integration needs.
- Use fit-to-center for orientation. Collapse and expand to explain one branch at a time; return to the text for exact types and values.
- Inspect alternate records separately. A visual overview is not a contract check for every response.
- Before sharing, remove sensitive fields from the actual document. Keep the relevant source excerpt with any diagram so the reader can verify the path.
For example, the path we traced in the single-user response was address.geo.lat. In a collection it becomes an indexed path such as users[0].address.geo.lat only if your own code names the imported array users. That variable name is application code, not a field added by JSON Crack.
The boundary of this test
Our import and navigation tests required no account or payment. The toolbar prominently links to an Upgrade to Pro Editor destination at ToDiagram; we stayed in JSON Crack and did not evaluate that product or its pricing. Do not transfer another product’s paid limits or features to this review.
The official project repository is Apache-2.0 licensed and describes local processing and image export. We inspected a Download Image dialog offering PNG, JPEG and SVG, plus background-color controls. We did not obtain and inspect a downloaded file, so export fidelity and clipboard output are not verified here.
The project’s local-processing statement is a provider claim, not a network audit by us. Our retest imported embedded JSON data URLs rather than retrieving a remote API response. The hosted editor still had to load initially; this is not evidence of offline startup or zero network traffic. We did not test an installed local deployment, the browser extension, other formats or offline startup. Use sanitized samples unless your organization has approved the particular environment.
For the map-widget handoff
The single-record view met our inspectability check: the address → geo branch and its values were readable beside the source at the tested desktop viewport. The ten-record view failed the all-values readability goal after fit-to-center, despite remaining a useful shape overview. I would send the single-record view and the source path address.geo.lat, with a note that the coordinate is a string in this fixture. I would leave the ten-record overview out of a ticket that needs readable values. If the job is extracting coordinates from every record, a focused jq query or formatted text is easier to verify than zooming through the graph.
There is no mobile-layout, clipboard-export, latency or large-file qualification here: those checks were not completed. The ten-record test is a readability check, not a crash threshold. If confidential-data isolation is your bottom line, our lack of a network audit means this review cannot qualify the hosted editor for that job.
Collapse helps explain one branch at a time; it does not sanitize the source. Remove private fields before import or screenshots, and keep the source excerpt beside the diagram so a teammate can check the exact nesting.